
Sample Information
Enter specimen name and geometry (defaults provided).
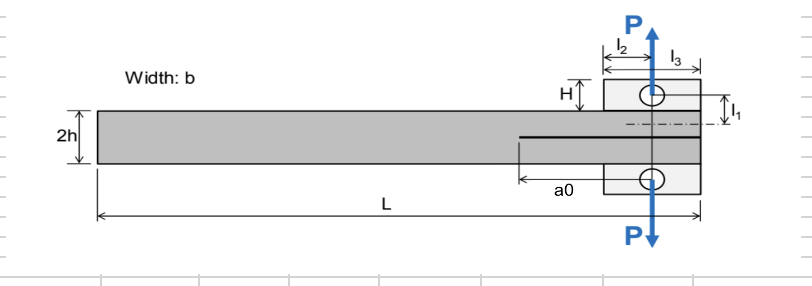
• l1 = distance from loading pin to the nearer support
• l2 = distance between the two supports (support span)
• a₀ = initial precrack length (measured from load line to crack tip)
Changing these values will directly affect the calculated compliance, energy release rate, and mode-mixity results.
Crack Calibration to a_eff & da/dN Calculator
This tool helps you process fatigue test data from a Double Cantilever Beam (DCB) Mode-I test. You upload the raw load–displacement CSV, use a few visual crack length measurements to calibrate compliance, and then obtain effective crack length aeff and crack growth rate da/dN.
Step 1 – Upload fatigue test CSV
Upload the raw load–displacement history from your DCB Mode-I fatigue test. Each row should contain the cycle count N, maximum/minimum load Pmax, Pmin, and corresponding opening displacements dmax, dmin.
Detected columns
N, Pmax, dmax, Pmin, dmin.
Delimiter can be comma (,) or semicolon (;). In a DCB Mode-I test, the opening
displacement at the load line is used to estimate compliance at each cycle block.
Final Table – N, Pmax, dmax, C, a_eff
This table lists the filtered points used to build aeff, keeping only rows where the effective crack length increases by at least 0.1 mm.
| N | Pmax [N] | dmax [mm] | C [mm/N] | a_eff [mm] |
|---|
log₁₀(C) vs log₁₀(a_eff)
This plot lets you visually check the calibration in log–log space. A good calibration should appear approximately linear.
da/dN (7-point & Secant) – a_eff increment ≥ 0.1 mm
For each eligible point, the crack growth rate da/dN is estimated using a 7-point linear regression and a secant method, then the percentage difference is reported.
| a_eff [mm] | N | da/dN 7-pt | da/dN sec | Error [%] |
|---|
Export a compact PDF report including calibration parameters, tables and plots.